Why I Rewrote Windows Event Viewer (and Gave It an MCP Server)
The Windows Event Viewer that ships with the OS hasn't really changed in many many years. It's an MMC snap-in. It blocks the UI on every read. Searching for things isn't easy. And the moment you ask it to load anything substantial — say, a couple of days of Application events on a busy box — you sit and stare at a frozen window until it decides to come back.
For my job I frequently have to go through a customer's event log files and search for clues. Sometimes multiple EVTX files across days of noisy logs. Missing events that I should have seen, getting EVTX logs confused, having to scroll through dozens of lines searching and wasting time, only to lose it and not find it again when I have to show it to someone else.
So I built Simple Event Viewer — a WinUI 3 app that does the things eventvwr should already do, plus a few things it never will. It took about a couple of days of prompts (while playing video games) from first commit to first usable build.
The gripes I was solving
In rough order of "how often it made me close the built-in viewer in frustration":
- Loading blocks the UI. Open a 50k-event log and the window just freezes. There's no progress indication that respects the fact you're still alive while it churns.
- Filters suck. Trying to find an app crash, or a particular provider is painful, having to go through meaningless empty log folders, a filtering panel that barely works at all and not knowing in what area the log you are looking for actually is.
- No live count of what your filter is doing. You guess at the impact of each filter knob; the only way to verify is to apply and wait, and wait.
- EVTX files are second-class. Saved logs open in a separate snap-in tree with a different feature set. Cross-machine triage is awkward.
- Export is hostile. You can save filtered events back out as XML — but it's the wire-format XML, not anything you'd want to grep, csv-import, or paste into a ticket.
- It cannot help you understand what you're looking at. A wall of identical-looking 1000-level errors and you, alone, with a search engine.
What I actually built
The streaming load was the first thing. Events read off the log on a background thread land in a ConcurrentQueue; a DispatcherQueueTimer drains up to 500 per tick into the UI. You see the first events within a few hundred milliseconds and the rest pour in while you start filtering. A parallel background query gets the total count so the progress string can read Loading... (N/M) instead of (N/?). After the initial load completes, an idle prefetch (5 s delay) starts pulling older events into memory so widening the time range later is instant.
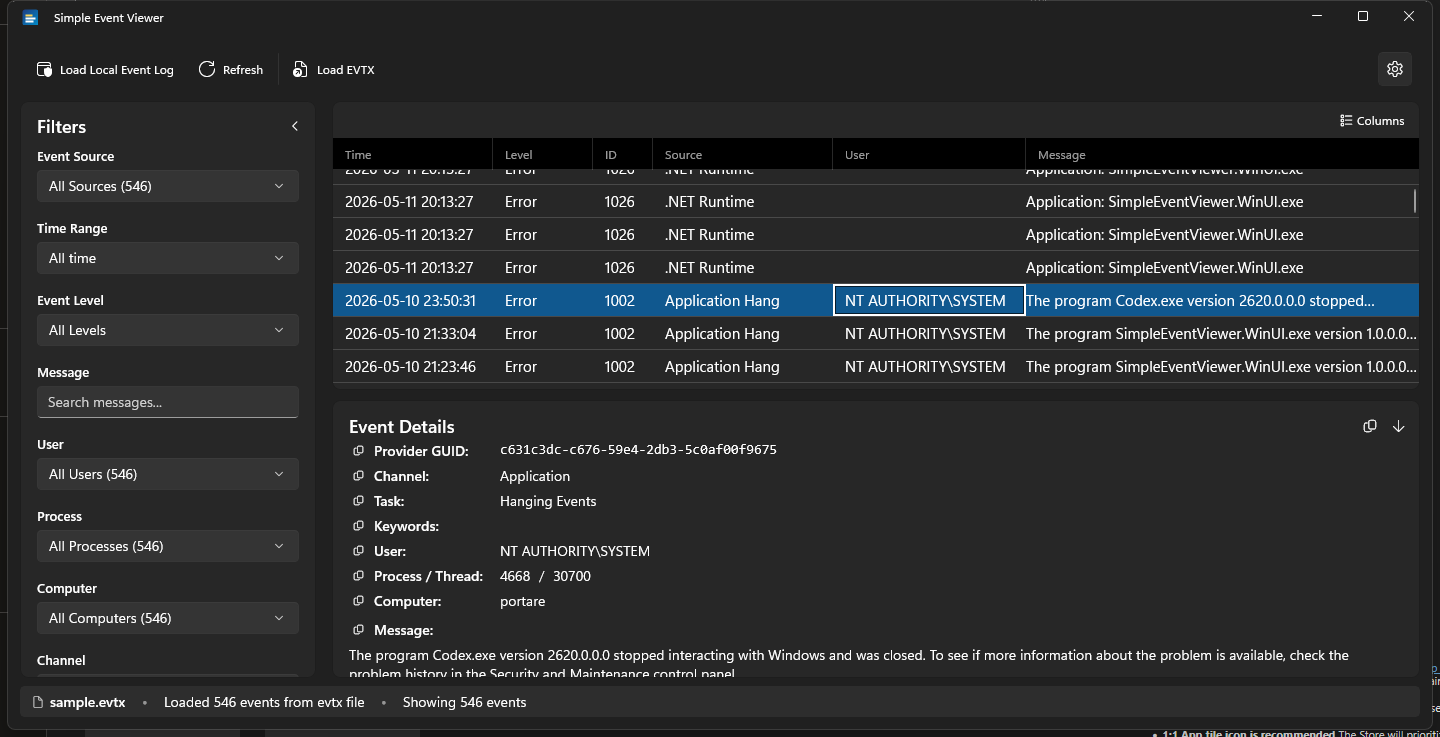
The cross-aware filters were the second. Every filter dropdown — source, level, user, process, computer, channel — narrows its options to values that appear in events matching the other filters, with live counts. So you set "last 24 hours" and the Source list collapses from the 800 providers that have ever logged anything on this machine to the maybe-30 that have logged in the last day. Same for narrowing in the other direction. A thin accent bar next to a filter's label tells you at a glance which dimensions are non-default.
The grid is a standard DataGrid with the boring stuff — multi-select, Ctrl+A, sortable columns, drag-to-reorder. Column widths and visibility persist across launches (off-switchable). Level column is a colored badge or whole-row tint depending on taste. I love being able to tune it to the way that /my brain/ wants to go through the logs.
Export goes to CSV / JSON / XML — actual usable shapes, with proper escaping. The same exporter feeds the right-click "Copy as → CSV/JSON/XML" menu, so the on-clipboard and on-disk payloads match. Right-click → "Copy row" gives you tab-separated for spreadsheet paste.
Files: EVTX is first-class — open sample.evtx and the title bar updates, the refresh button reads "Reload sample.evtx," and every filter and export works the same as it does against live logs. XML and ETL loaders sit behind an experimental toggle because they're flakier (the XML parser only really likes wevtutil qe ... /f:xml output; ETL provider rendering is hit-or-miss for kernel traces).
Why an MCP server
Then I realized, what if I didn't have to manually search them at all, and could point my favorite AI at it. It took maybe a few prompts and I had a fully functional MCP server that the AI could use AND it know whether it was a live log or loaded EVTX
Model Context Protocol is a small JSON-RPC dialect for letting LLMs call tools running locally. With this MCP server, then any MCP-aware client (Claude Desktop, Claude Code, VS Code with the right extension, Cursor) can ask it questions directly:
- "Summarize the errors in the last hour."
- "Find events mentioning
WHEA-Loggerand show the worst three." - "How many warnings from
DistributedCOMsince yesterday?"
The server is in-process, bound to 127.0.0.1 only, default port 7321, and exposes five tools:
| Tool | Purpose |
|---|---|
current_source | What's loaded (live logs or a filename) and total count |
event_summary | Total + breakdown by Critical / Error / Warning / Information / Verbose |
list_events | Newest-first paginated slice with optional level / source filters |
search_events | Substring search across messages |
get_event | Full detail for a specific event by index |
Settings page has copy-paste config snippets for VS Code, Cursor, Claude Desktop, and Claude Code. Off by default — flip it on in Settings → MCP Server.
A quick sanity check from a terminal:
curl http://127.0.0.1:7321/ -H "content-type: application/json" `
  -d '{"jsonrpc":"2.0","id":1,"method":"tools/call",`
       "params":{"name":"event_summary","arguments":{}}}'
That returns the level breakdown of whatever's currently loaded — live logs or a file you just dropped in.
Themes, because of course
System / Light / Dark plus five curated presets — Nord (dark), Dracula (dark), Solarized (dark), Sepia (light), High Contrast. They're not just accent swaps; each preset overrides the page/card/text surface colors so they actually look different.
What I'd still like to do, but lower priority for me at the moment
- A diff view between two time ranges or two files. ("What's new since yesterday?")
- Saved searches — name a filter + time range combo and recall it from a menu.
- Multi-file open for cross-machine correlation. Today you can have one source at a time.
- A more honest ETL story. Right now it's an experimental toggle and limited; doing it properly probably means TraceProcessing. I will probably bake this into FindNeedle instead since that is more optimized for /giant/ log files.
Get it
- Repo: github.com/guscatalano/SimpleEventViewer
- Latest release: v1.2.0 — MSI and MSIX, both x64. Windows 10 1809+.
- Tool page on this site: /gtools/simpleeventviewer
Issues and PRs welcome, especially edge cases in the XML/ETL loaders or ideas for additional MCP tools.
If this saved you a frozen-Event-Viewer afternoon, coffee is appreciated ☕.