AI Proxy beta
A transparent inspector and rule engine that sits between your AI clients and their upstreams — logs every request, threads them into conversations, and applies rules that fix model behaviour on the way through.



Install
# npm — self-contained binary, no Python needed:
npm install -g guscatalano-ai-proxy
ai-proxy

# Or Python (3.10+):
pipx install guscatalano-ai-proxy

# Or Docker — UI at http://localhost:8000/__proxy/
docker compose up -d

# Windows: ai-proxy-<version>.msi from the latest release
# https://github.com/guscatalano/AI_Proxy/releases
Source
What it does
Point a client at it — ANTHROPIC_BASE_URL, OPENAI_BASE_URL, or OLLAMA_HOST — and every request, response, tool call, token count, and conversation thread is captured without changing anything else about your setup.
Observe
- Every request in full — bodies, headers, streaming chunks, tool calls, token counts, latency, and which rule verdict applied. Searchable, filterable by client app.
- Conversations, not just requests — automatic threading with a turn-by-turn timeline, in-conversation search, and collapsible long messages.
- Live view — one tile per active conversation, token counts updating as the model generates; request detail streams the reconstructed output mid-flight.
- Knows who's calling — fingerprints Claude Code, Copilot Chat, Cursor, Continue, Cline, the Anthropic and OpenAI SDKs, LangChain and others from headers, User-Agent, and system-prompt shape.
- Artifacts — every file, URL, and directory a tool call touched, aggregated by path with the captured content inline.
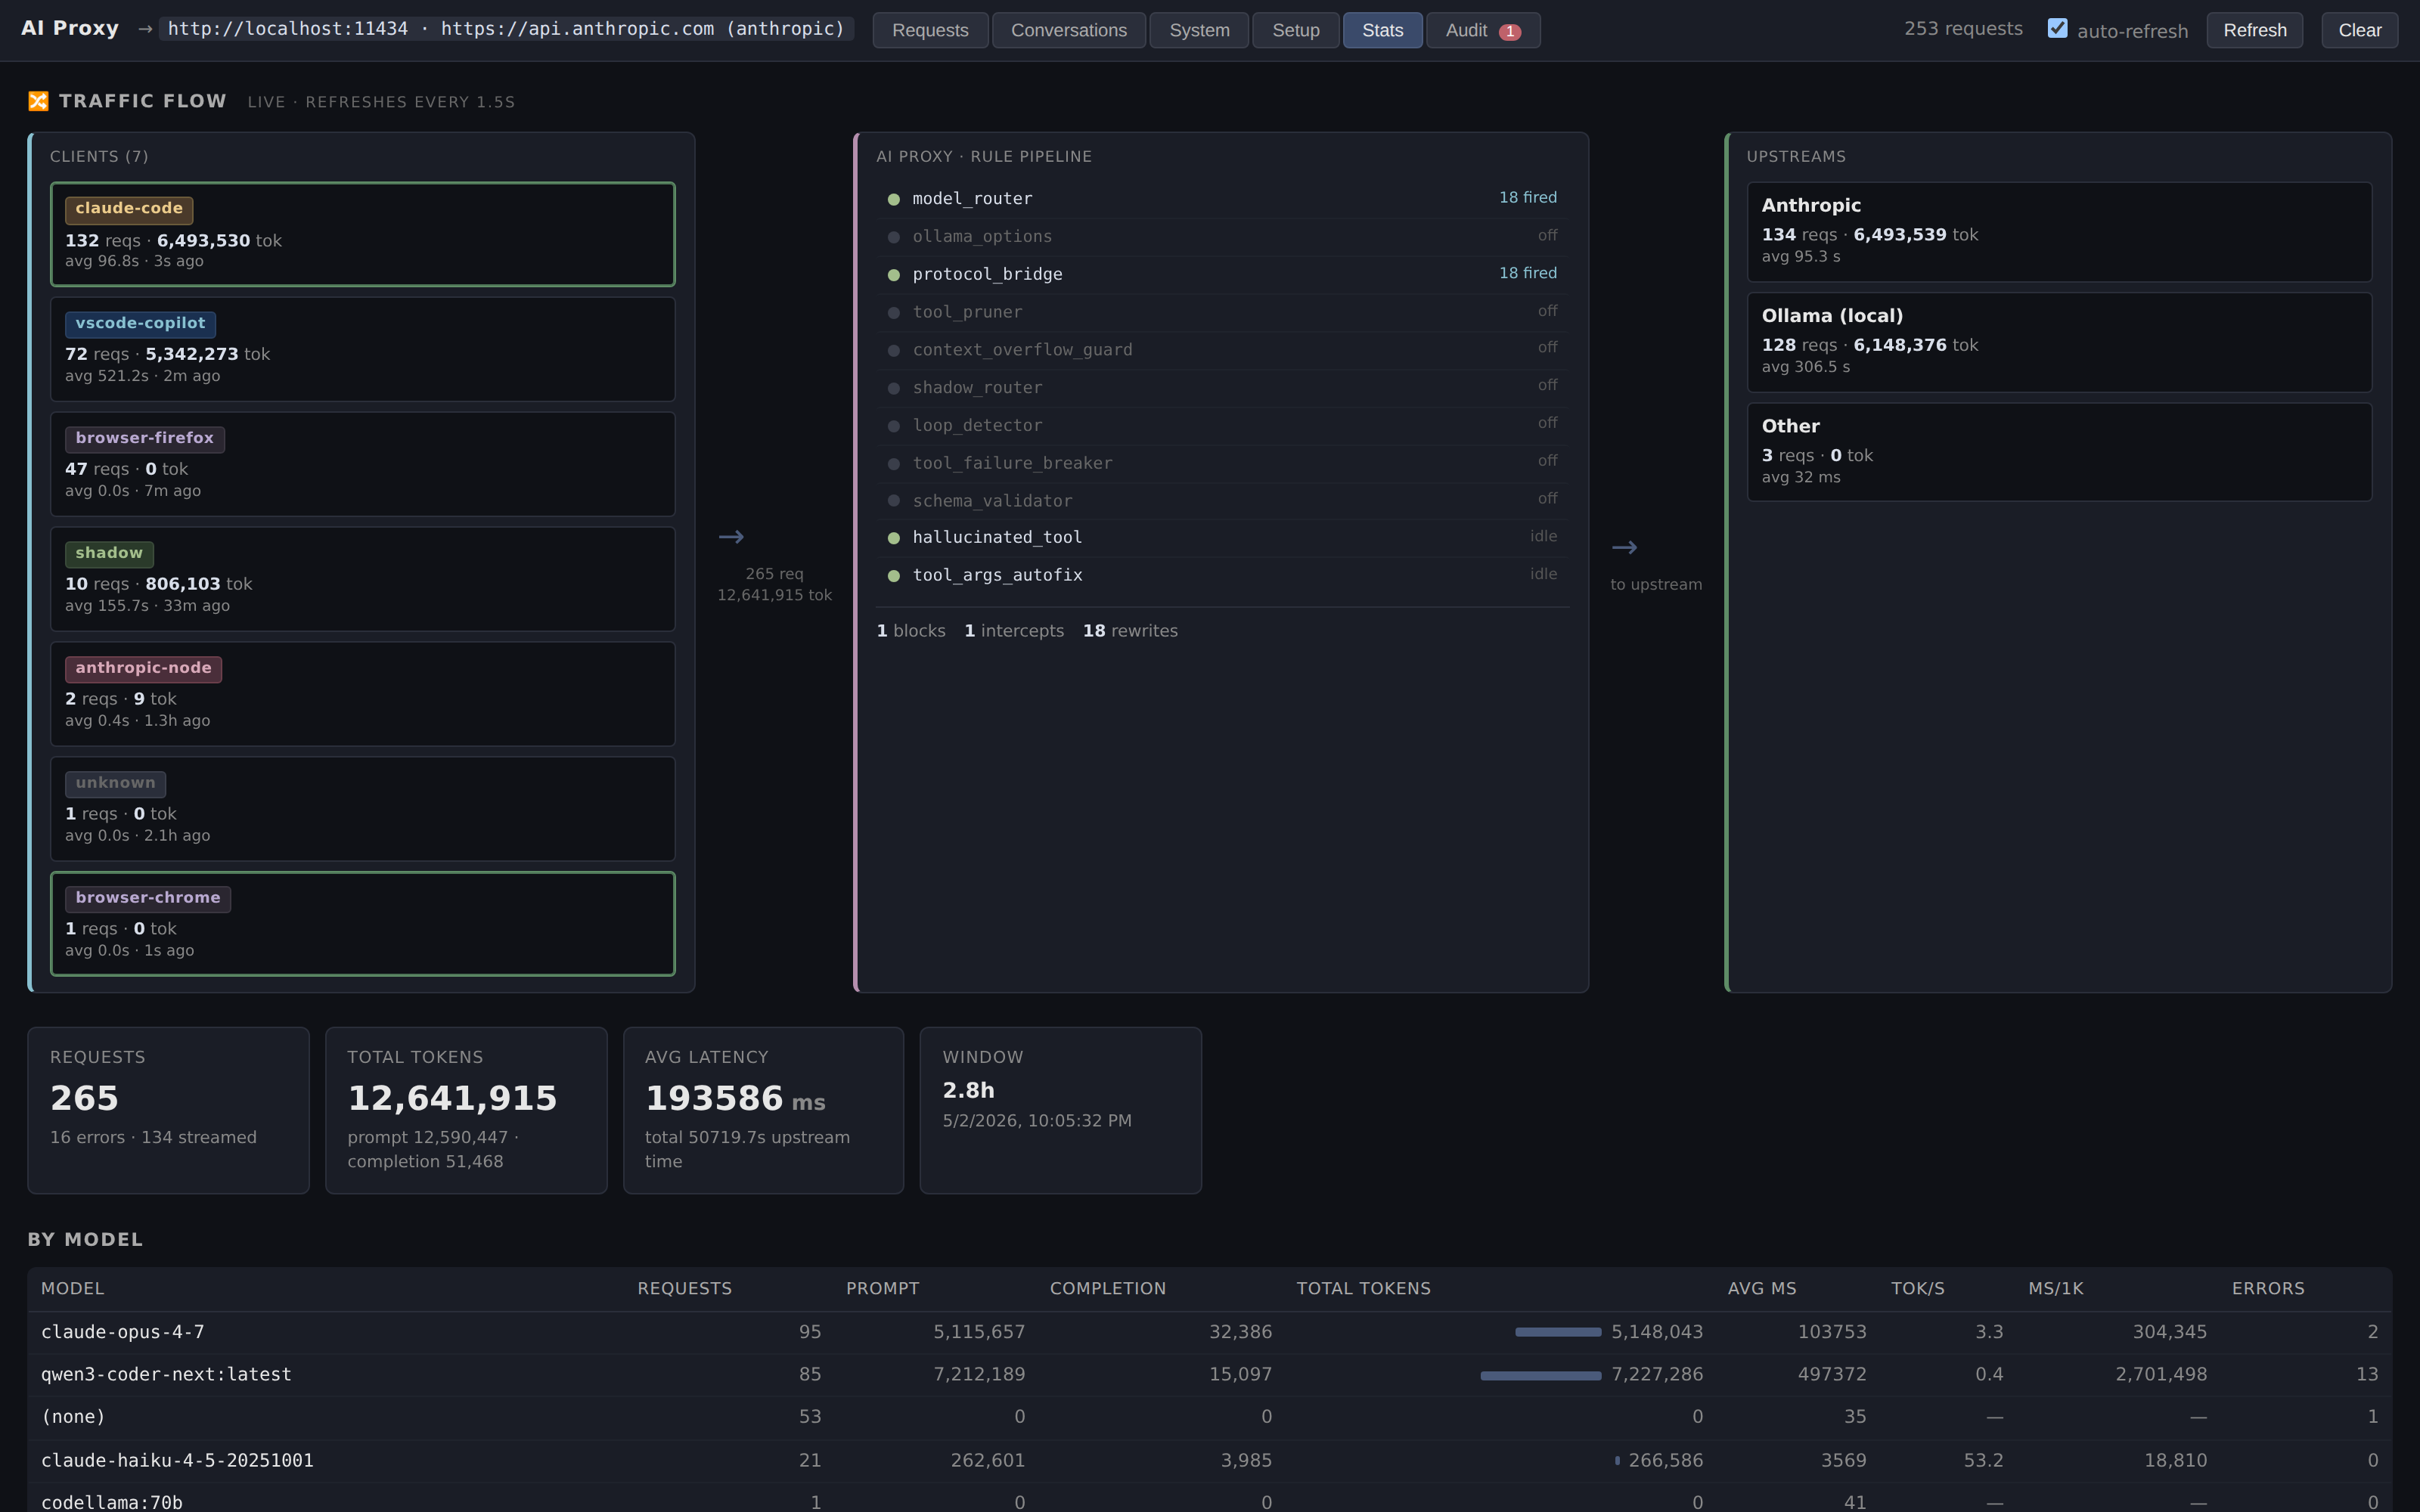
- Stats and system metrics — per-model and per-client tokens, latency percentiles and throughput, alongside CPU, GPU utilisation, VRAM, and which models Ollama / LM Studio / vLLM currently have loaded.
Intervene
- Translate Anthropic ↔ OpenAI — point Claude Code at any OpenAI-compatible backend; request bodies, responses, and SSE streams are converted both ways.
- Route across models and upstreams by model name, prompt size, tool or image presence, client IP, or path.
- A rule pipeline — pre-flight (block / warn / transform) and post-flight (intercept / autofix) rules that catch loops, repair malformed tool calls, prune tool definitions that are sent every turn and never used, and prevent silent context-window truncation. Edited as JSON, applied on the next request, no restart.
- Compress context deterministically, with a shadow mode that measures the saving before you commit to it.
- Shadow runs — send a request to your primary upstream and a local model at once, and get a side-by-side comparison of latency, tokens, tool-call agreement, and text similarity.
- Kill an in-flight request to free a GPU slot, or flip panic mode to 503 everything while keeping the dashboard up.
Automate
- Benchmarks — sweep models × context sizes × thinking modes × temperatures, graded against executable task suites rather than vibes. Every report in the benchmarks section of this site came out of it.
- Scheduled tasks — run a prompt one-shot or on a cron/
every 10mschedule. - Auditor suggestions — it reads your recent traffic and proposes config changes, like routing short requests off an expensive model.
- MCP server — exposes the same data over Model Context Protocol, so an LLM can query your traffic patterns directly.
Before you run it
The dashboard binds to all interfaces on port 8000 with no authentication, and the database stores request and response headers verbatim — which means any Authorization or x-api-key your client sends is written to disk in cleartext. That's fine on an isolated machine and a bad idea anywhere else.
Set PROXY_HOST=127.0.0.1 if only the local machine needs it, or put it behind your own auth. The security notes spell out the full surface, and the privacy notes cover what gets stored.